Gamma scalping/hedging, an advanced and active option trading strategy, is predominantly utilized by seasoned traders and market makers. Its intricate mechanics and practical implications provide both new and experienced traders with deeper insights into market dynamics and options trading.
Gamma Scalping Basics
The foundation of gamma scalping/hedging lies in the price movements within delta-neutral strategies. When a trader strives to maintain delta neutrality, they seek a net delta of zero. However, due to gamma exposure, delta can change as the market price fluctuates. Gamma scalping/hedging emerges as a solution, enabling traders to profit from volatility rather than relying on the direction of market movement.
Gamma scalping/hedging is essentially a tactic in options trading in which you’re playing the differences between what the market thinks will happen (implied volatility or IV) and what actually happens (realized volatility or RV). Imagine a scenario where a stock is priced at \( $100 \), and we use a straddle, a popular strategy in volatility trading to trade the realized versus the implied volatility. To understand this better, let’s look at an example.
Example with a Straddle on a Stock Trading at \( $100 \)
Alright, let’s dive into the thrilling world of options trading with a real-world example, specifically a straddle that expires today (0 DTE) on Stock S, which is currently priced at a cool \( $100 \).
So, here’s the game plan: You snag a straddle by grabbing both a call and a put option, each with a strike price of \( $100 \). These options are set to expire in a day, and they’re sitting at an implied volatility (IV) of 16%. The cost? About \( $1 \) per option, but remember, with the options multiplier being 100, you’re really shelling out \( $100 \).
Now, let’s play out a couple of scenarios:
Scenario 1: Stock S Takes a Leap to \( $101 \)
Here’s where it gets exciting. After you’ve bought your straddle, Stock S decides to climb up to \( $101 \). As the value of your call option soars, it starts to overshadow any loss you’re taking on the put option. This is where understanding the dynamics of delta and gamma really pays off.
Now, as a savvy gamma scalper, you’re not just sitting back and watching. You’re actively managing your position to keep things balanced. This means selling off shares to maintain that ideal delta-neutral position. As the call option’s delta approaches 0.7, due to it being in the money, your attention to detail becomes crucial.
But here’s a critical point: to be delta-hedged again, you would likely need to sell about 70 stocks. Why? Because your in-the-money call option gives you the right to buy 100 stocks at \( $100 \) – your strike price – at expiry. This means that if the stock price is above \( $100 \), your call option is equivalent to being long 100 shares of the stock, from a delta perspective, multiplied by the probability that you will stay above the strike at expiry.
Therefore, to counterbalance this, you’d sell 70 shares to achieve a delta-neutral stance. This is a dynamic process, and as the market moves, you need to adjust your position continuously. It’s a delicate dance of buying and selling, all while keeping an eagle eye on those delta figures provided by your broker. This process effectively gives you the exposure to the prior mentioned realized volatility.
Scenario 2: Stock S Dives Down to \( $99 \)
Now, suddenly the stock starts dropping. If Stock S dips to \( $99 \), your put option’s value is going to rise. Thanks to your earlier move of selling shares when you hedged against the call option’s rising delta, this drop is actually in your favor. It’s shopping time – you can buy back the stock at a lower price and pocket the difference. To stay on top of things, you’ll need to buy shares to adjust for the now increased delta of your put option. In this case you would have bought back the 70 stocks you sold at \( $101 \) at a price of \( $99 \), pocketing a profit of $2 per stock. This is essentially you doing your gamma scalp.
The beauty of this strategy is that it can work out well regardless of which way the stock wiggles. If Stock S kept on climbing after you sold you 70 stocks, that call option of yours will eventually give you the right to snap up 100 shares at the strike price. So, even if you initially sold 70 shares to hedge, a significant rise in the stock price could effectively leave you long on 30 shares during the ascent.
PnL
Let’s do some quick math. You earn \( 70 \times 2 \) dollars from the shares you sold and then bought back, minus the \( $100 \) you spent on the straddle. Your pocket change? A neat \( 40 \) dollars. This, my friends, is Gamma (\( \Gamma \)) scalping flexing its muscles in your favor. But remember, as the clock ticks down to the option expiration, the straddle’s time value is going to drop to zero. That’s Theta (\( \Theta \)) nibbling away at your potential gains. If Stock S had decided to just lounge around at \( $100 \) the whole time, you’d be kissing goodbye to your \( $100 \) investment in the straddle. The goal here is to make enough from those Gamma scalp swings to offset the Theta decay. This entire strategy is essentially you getting exposure to realized volatility, which in this case was higher than the implied volatility.
In gamma scalping/hedging, profitability is closely tied to volatility and the theta value. High volatility in the market typically leads to a higher theta, which represents the cost of holding an options position. The theta value increases as options approach their expiration, reflecting the time decay of the option’s value.
The key to successful gamma scalping/hedging in a high volatility environment is to actively adjust your positions to capitalize on significant price movements. By doing so, you’re essentially aiming to generate enough profit from these adjustments (gamma scalping/hedging) to offset the cost of theta. In simpler terms, your goal is to make enough small profits from the price changes (thanks to high volatility) to cover the cost of holding the options (the theta).
Realized vs. Implied Volality -> How Gamma Scalping helps
Navigating the dynamic dance between Gamma gains and Theta decay in options plays like straddles or strangles is a crucial skill for savvy traders. At the heart of this strategy lies the critical distinction between implied and realized volatility.
Implied Volatility (IV) is essentially the market’s forecast of how much a stock might swing. It’s the “expected” volatility baked into the option’s price. Realized Volatility (RV), on the other hand, is the actual rollercoaster ride the stock’s price takes in reality. When RV outpaces IV, that’s where the magic happens for traders: the value of your straddle can ramp up, offering prime opportunities for some savvy gamma scalping/hedging as we’ve just discussed.
So, how do you spot these golden opportunities? The key is in analyzing and comparing the historical RV against the current IV. RV has this tendency to be somewhat predictable, thanks to its autoregressive nature. By keeping an eye on these trends, you can get a leg up in predicting future movements and profit from gamma scalping.
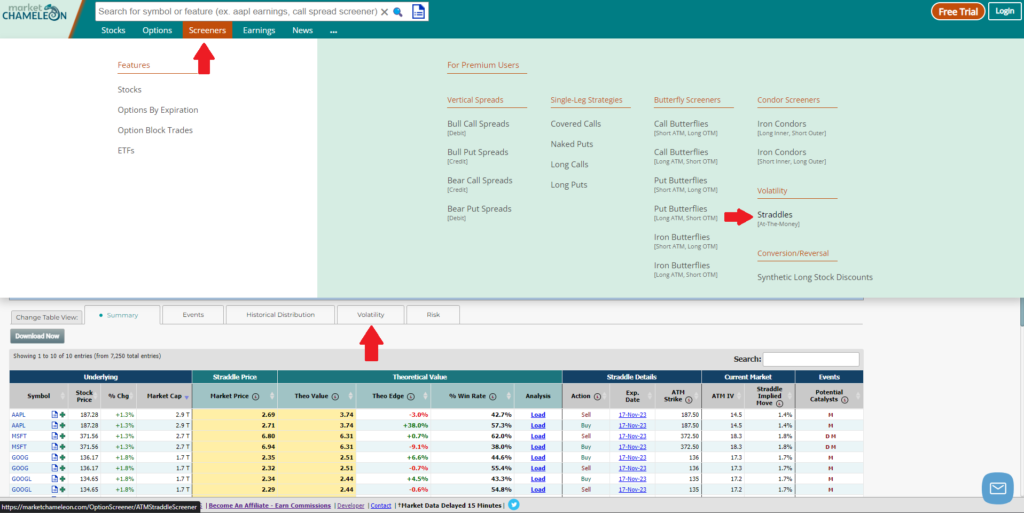
For those looking to streamline this process, the ‘Pro’ account on Market Chameleon is like having a secret weapon in your arsenal. It’s a treasure trove of data, helping you effortlessly spot stocks where the RV vs. IV ratio works in your favor. Once you’re logged into your ‘Pro’ account, head over to the ‘Straddles’ section under the ‘Screeners’ category – it’s easy to spot, just look for the red arrows in the screenshot below. Next, hit up the Volatility tab (also indicated by a red arrow). This feature is a game-changer, offering a systematic way to pinpoint top-notch opportunities to leverage volatility in your trading game plan.
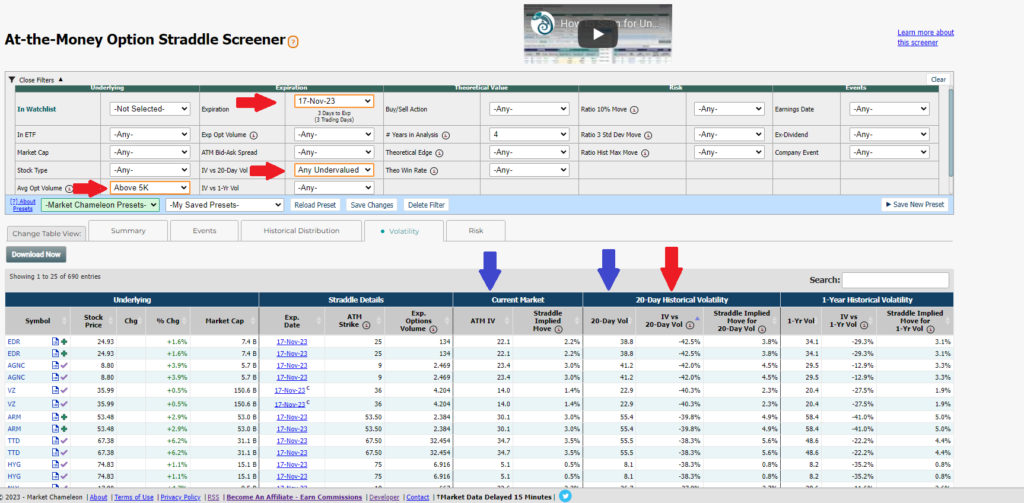
Diving into the nitty-gritty of volatility analysis for your straddle plays is where the real action begins. When you fire up the ‘Straddles’ feature, you’re greeted with a table brimming with potential. The first step? Tailoring those filters to zero in on exactly what you’re after. When I’m in the market for a straddle, particularly when the realized volatility seems like a bargain compared to its implied counterpart, I set my sights on the front weekly expiration. I then tweak the IV vs 20-day Vol filter (look out for the red arrows in the image below) to highlight only those implied volatilities that are undervalued relative to the recent realized volatility – a predictor of the near-future realized volatility.
Next up, I sort the list by IV vs 20-day Vol, arranging it from the most negative to the least negative values. This is shown in the final red arrow, right next to the blue one. Now, the table is perfectly curated, displaying only the crème de la crème of trading opportunities.
From here, you can peruse through these top picks, comparing the ATM IV column with the 20-day Vol (indicated by the blue arrows) and even the 1-Year Vol. While the 1-Year Vol offers a less immediate perspective, it can still provide valuable insights into longer-term realized volatility trends. The key takeaway? The lower the ATM IV is in comparison to the recent realized 20-day Vol, the greater the opportunity to jump on buying the straddle. This move effectively lets you buy into the implied volatility, gaining exposure to the realized action.
By harnessing these sophisticated tools, you’re not just making trades; you’re aligning your strategy with a thorough, analytical approach to volatility. This isn’t just trading – it’s smart, strategic, and optimized for scalping success in the ever-shifting world of options.
Market Monitoring
We’re not just about dishing out theory; we’re also here to serve you some real, juicy opportunities straight from the market’s pulse. That’s why we’ve got these live, dynamic tables set up for you – a window into the market as it breathes and moves right now.
In our first showcase, the green table, we’re rolling out opportunities where the expected realized volatility is outdoing the implied volatility. This is your cue to consider buying a straddle. But wait, there’s more! We’ve got a little secret weapon for you: our exclusive ‘Ratio’ column. This bad boy is the key to quantifying how juicy each opportunity really is.
Here’s the lowdown on the Ratio values for buying straddles:
- Anything clocking in at 1.2? That’s a solid opportunity to snap up options.
- Hit 1.3, and you’re looking at phenomenal potential.
- And the holy grail? A Ratio of 1.5. That, my friends, is the kind of opportunity that comes once in a lifetime.
So, buckle up and dive into this table. It’s not just about spotting opportunities; it’s about finding the ones that scream ‘winner’. And with our Ratio metric, you’re not just trading; you’re trading with the insight of a true Theta Titan.
Opportunities to Buy Straddles
We’re not just about identifying those sweet buying opportunities; we also have our eyes locked on the best spots for raking in that Theta – I’m talking about selling straddles. That’s right, we’re tracking down the most expensive (compared to realized) straddles out there in the market, and we’ve laid it all out for you in the table below.
But hold on, it gets better. We’re not just throwing random picks at you. We’ve meticulously filtered out underlyings with imminent events, like earnings announcements, because let’s face it – nobody wants to be on the selling end of a straddle when it’s about to go KABOOM.
And of course, our top-secret, exclusive ‘Ratio’ column is back in action. This time around, though, we’re flipping the script: a lower Ratio means a better selling opportunity. Here’s the breakdown:
- A Ratio below 0.9? That’s your green light for a good sell.
- Dip under 0.7, and you’re in extremely good territory.
- And if you spot a Ratio below 0.6, my friends, you’ve hit the sell of a lifetime.
So, there you have it. Whether you’re in the game to buy or sell, we’ve got the intel you need. Because being part of the Theta Gang means not just playing the market – it means outsmarting it.
Opportunities to Sell Straddles
Theta Gang, here’s an important heads-up: the tables we’ve been talking about? They’re not just a one-time show here. You can find them continuously featured on our Market Monitor page, a specially crafted section of our website dedicated to keeping a constant eye on all the potential opportunities we discuss.
The Market Monitor isn’t just a page; it’s your go-to hub for real-time insights. It’s where you can track, analyze, and stay ahead of the game with all the strategies and opportunities we dive into on this blog. So, whether you’re looking for the next big buy or the perfect sell, make sure to keep the Market Monitor page bookmarked. It’s your all-access pass to staying informed and ready to make those key moves in the market. Stay sharp, stay informed, and let’s keep winning with Theta Gang strategies!
Continue to the next part of this guide here.