It’s time to take a deep dive into the pulsating heart of options trading – implied volatility. If you’ve read the Summary of Theory page, you know that unraveling the PnL of your trades is like peeling an onion, layer by layer. In this section, we’re zooming in on one layer in particular: Vega (\(V\)).
How to make money trading implied volatility?
Think of Vega as the pulse rate of an option’s price—it tells you how sensitive your option is to the moods and swings of market volatility. It’s that magic number that can make or break your trade.
Here’s a short explanation: if your position has a Vega of 1, and the market’s implied volatility spikes by just one point (1%), you’re looking at a sweet $1 bump in your PnL (provided everything else stays put). It’s as simple, yet profound, as this equation:
\(PnL≈ V×\Delta \sigma\)
But here’s the million-dollar question – how can we smartly trade Vega and surf the volatility wave all the way to profit town? It boils down to leveraging historical hindsight. Before diving in, we need to understand that in the world of options trading, implied volatility (IV) is not just a term; it’s the pulse of market predictions, indicating how much a stock price might dance in the near future. However, the true artistry comes from not just eyeing the IV in isolation but from dissecting it against the canvas of its historical performance. By comparing the current IV with its historical highs and lows, we gain insight into the market’s volatility expectations.
This is where Implied Volatility Rank (IVR) shines as a guiding light for traders. IVR is essentially a tool that helps traders assess whether the current level of implied volatility is high or low relative to its past. It’s not enough to simply understand that IV is a measure of the market’s forecast of a likely movement in a security’s price; smart traders juxtapose this with historical data to sniff out when the market might be overestimating or underestimating the potential for movement. Using IVR allows traders to spot anomalies or trends that might not be evident at first glance, enabling more informed decisions that could lead to profitable trades.
The IVR is a metric that can give us a statistical edge in our trading. It’s a percentage score that ranges from 0 to 100 and provides us with a snapshot of where the current IV stands in relation to its historical values over a specified period.
- IVR 0%: This is the floor of the IVR, indicating that the implied volatility of a stock is lower than it’s ever been historically. This presents a potential opportunity for traders to buy options because there is more room for volatility, and thus option premiums, to rise.
- IVR 100%: The ceiling of IVR suggests that the implied volatility is at its historical peak. This might be a perfect time to sell options since premiums are at their maximum, with the expectation that volatility will normalize to lower levels.
The ranges between 0% and 100% help traders gauge whether the current IV is low or high in a historical context:
- 0-20 percentile: Implied volatility is comparatively low, potentially indicating a good time to buy options.
- 21-50 percentile: IV is below the median, hinting that options might be cheaper than usual.
- 51-80 percentile: IV stands above the median, suggesting options prices are getting steep.
- 81-100 percentile: IV is near the top of its historical range, possibly signaling that it’s a favorable time to consider selling options.
Understanding these percentiles is crucial because they imply the relative expensiveness or cheapness of options. A low percentile means the market’s expectations for movement are subdued, potentially undervaluing the options if you expect a change. On the flip side, a high percentile points to a market bracing for significant moves, which could be overvaluing the options if you predict calm.
Remember, while IVR can be an excellent tool to judge the relative value of options, it’s not a standalone strategy. It’s an aid to help you decide when the odds might be in your favor. High IV can stay high for longer than expected, and low IV can remain low before any significant change. As with any market measure, it’s crucial to incorporate risk management and consider other market variables when trading based on implied volatility levels.
By keeping an eye on IVR and understanding what it indicates, you can sharpen your options trading strategy and potentially improve your market edge. Just like any indicator, use it wisely and never as the sole reason for a trade.
How to make find cheap IVR?
Now, let’s tackle the million-dollar question head-on: How do you hunt down options with attractively low implied volatility compared to their historical patterns? The golden key to this treasure trove of information is none other than MarketChameleon.
For those who are serious about their trading game, MarketChameleon‘s pro account is your new best friend. It comes equipped with a robust monitoring system that sifts through the noise to present you with options where the implied volatility is, frankly, a bargain.
Curious about where to find this gem? It’s nestled right under the ‘Options’ tab, labeled as ‘Implied Vol. Ranking’. And for those who are visual learners, don’t worry—we’ve got you covered. Take a gander at the image below, which will guide you right to the spot.
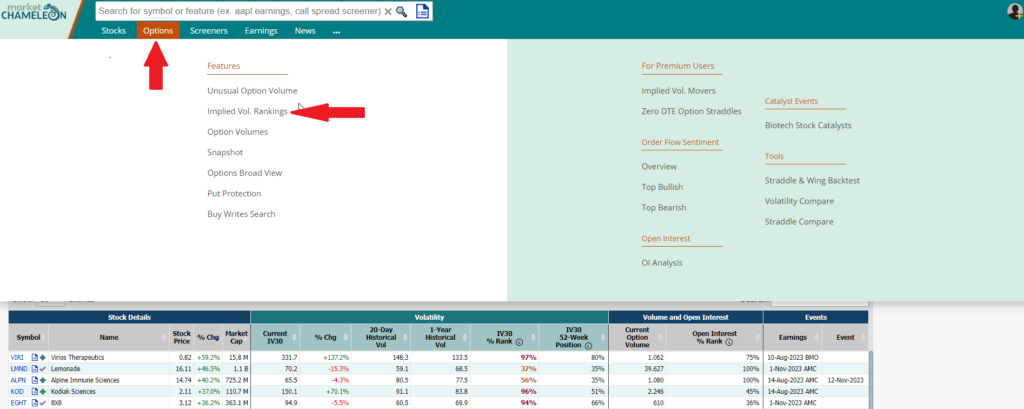
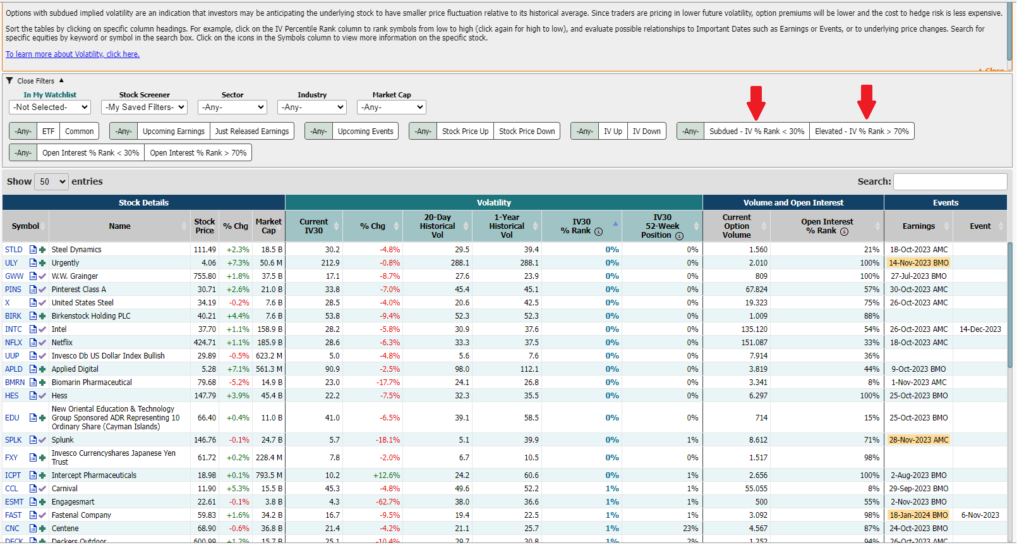
you’ll land on a page that presents a wealth of data. But don’t let the numbers intimidate you; we’re about to break it down into a simple strategy.
For Buyers: Seeking Low Implied Volatility
Imagine you’re looking to purchase a straddle or strangle, eyeing the chance to capitalize when the market hasn’t quite caught up with potential movements. Here’s the play:
- Look for the ‘Subdued – IV % Rank < 30%’ column, where the first red arrow in our guide points. This is where opportunity lies dormant, waiting to be awakened.
- Sort the IV30 % rank from lowest to highest. The options that appear at the very top are your hidden gems; they’re historically the least expensive. By constructing a delta-neutral strategy such as a straddle or strangle here, you’re placing your bet where the odds are most in your favor.
For Sellers: Maximizing Premiums
Now, if your strategy leans towards selling, seeking out premium prices for your options, the focus shifts:
- Navigate to the area marked ‘Elevated – IV Rank > 70%’, where the second red arrow guides you.
- Sort these options from highest to lowest. These options are like the fine wines of the options world — they’ve historically fetched higher prices, making them ideal candidates for selling.
By selecting options in these specified IV rank ranges, you tailor your approach based on historical volatility data, increasing the likelihood of the market moving in your favor. Remember, for buyers, low IV ranks suggest undervaluation, while for sellers, high IV ranks could indicate overvaluation.
Bringing It All Together
Each step you take in this process isn’t just about executing trades; it’s about informed decision-making. You’re not just buying or selling; you’re strategically positioning your trades where historical data shows you have the best chance to succeed. And with MarketChameleon’s analytics, you’re never flying blind.
Stay tuned as we’ll dive even deeper, unraveling the complexities and turning them into actionable strategies. The tables and data are more than just numbers; they’re your roadmap to smarter, more profitable trades.